Please find the python scripts to reduce and plot the data at this
link
and let me know of any bugs/comments/questions. The scripts should produce the plots below, with SNRs shown in the Table. Note the SNRs may not be exactly the same if changes are made to the methods of computing PCA (ie random SVD vs the data covariance matrix).
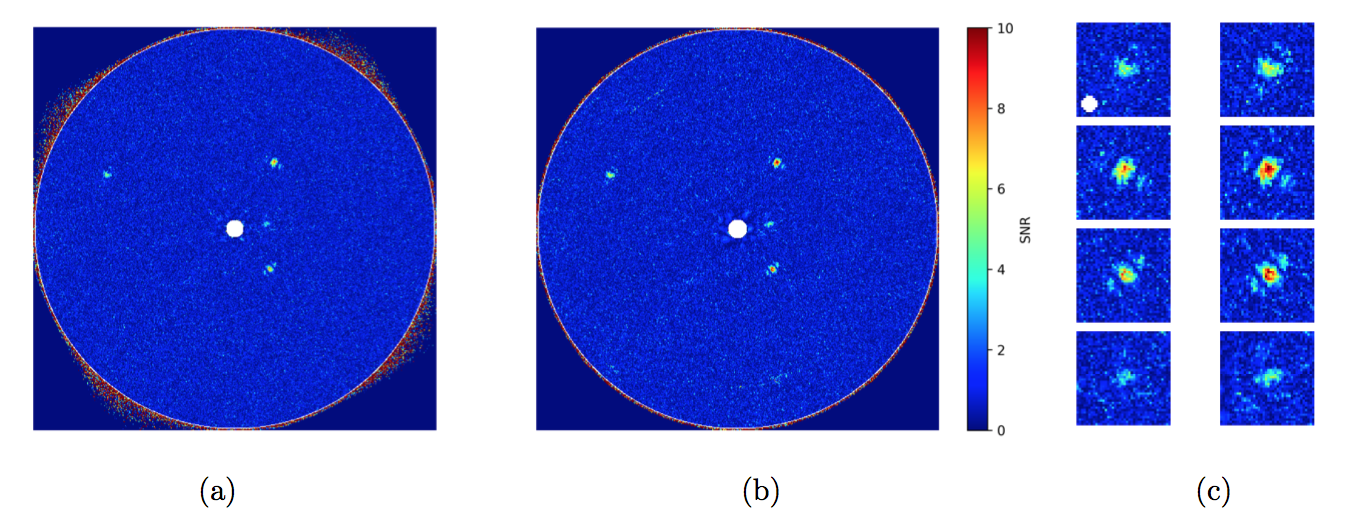
Fig. 1.—: (a) ADI reduction of HR8799 data, using conventional data medianing. (b) The same reduction using the variance-weighting method. (c) From top to bottom, subframes of planets b, c, d, and e in conventional and variance-weighted ADI. The white circle shows the photometric region of interest used to calculate SNRs. In all images, the colorscale is the same, with the color showing SNR. Note two streaks in the variance-weighted image due to uncorrected bad pixels.
Reduction algorithm
SNR, ADI; b, c, d, e
SNR, weighted ADI; b, c, d, e
% improvement
PCA, 5 comp.
3.86, 7.67, 5.14, 3.37
4.55, 9.59, 6.72, 4.21
18, 25, 31, 25
PCA, 10 comp.
3.72, 5.8, 5.1, 2.92
4.6, 7.42, 6.71, 3.46
24, 28, 31, 18
PCA, 15 comp.
3.37, 4.51, 3.99, 2.33
4.16, 5.72, 5.48, 2.54
24, 27, 37, 9
Annular PCA, 5 comp.
3.85, 8.25, 5.66, 4.24
4.78, 9.61, 7.72, 4.49
24, 16, 36, 6
Annular PCA, 10 comp.
3.87, 5.41, 4.69, 3.36
4.79, 6.74, 6.45, 4.02
24, 24, 38, 20
Annular PCA, 15 comp.
3.7, 4.64, 3.89, 2.95
4.57, 5.48, 5.24, 3.66
23, 18, 35, 24
LLSG, 5 comp.
5.16, 8.02, 6.32, 3.66
5.84, 8.58, 7.53, 4.07
13, 7, 19, 11
LLSG, 10 comp.
4.04, 6.23, 2.93, 1.26
4.72, 6.53, 3.64, 1.58
17, 5, 24, 25
LLSG, 15 comp.
3.78, 4.13, 2.59, 0.96
4.39, 4.39, 3.19, 1.19
16, 6, 23, 24
Table 1:: Comparison of SNRs achieved using conventional ADI and variance-weighted ADI, for the planets around HR8799, using different reduction algorithms. “PCA” corresponds to principal components analysis calculated over the full frame; “Annular PCA” is the same except calculated over annular regions six pixels wide; “LLSG” refers to the low-rank plus sparse decomposition algorithm. In all cases, the reductions are identical except for the final derotation and medianing step. The SNRs are calculated on a per-pixel level over a circular region of interest of radius 3; see the right panel of Figure 1 (the reduction corresponding to Figure 1 is shown in bold.) In all cases, the variance-weighted approach improves the SNR.
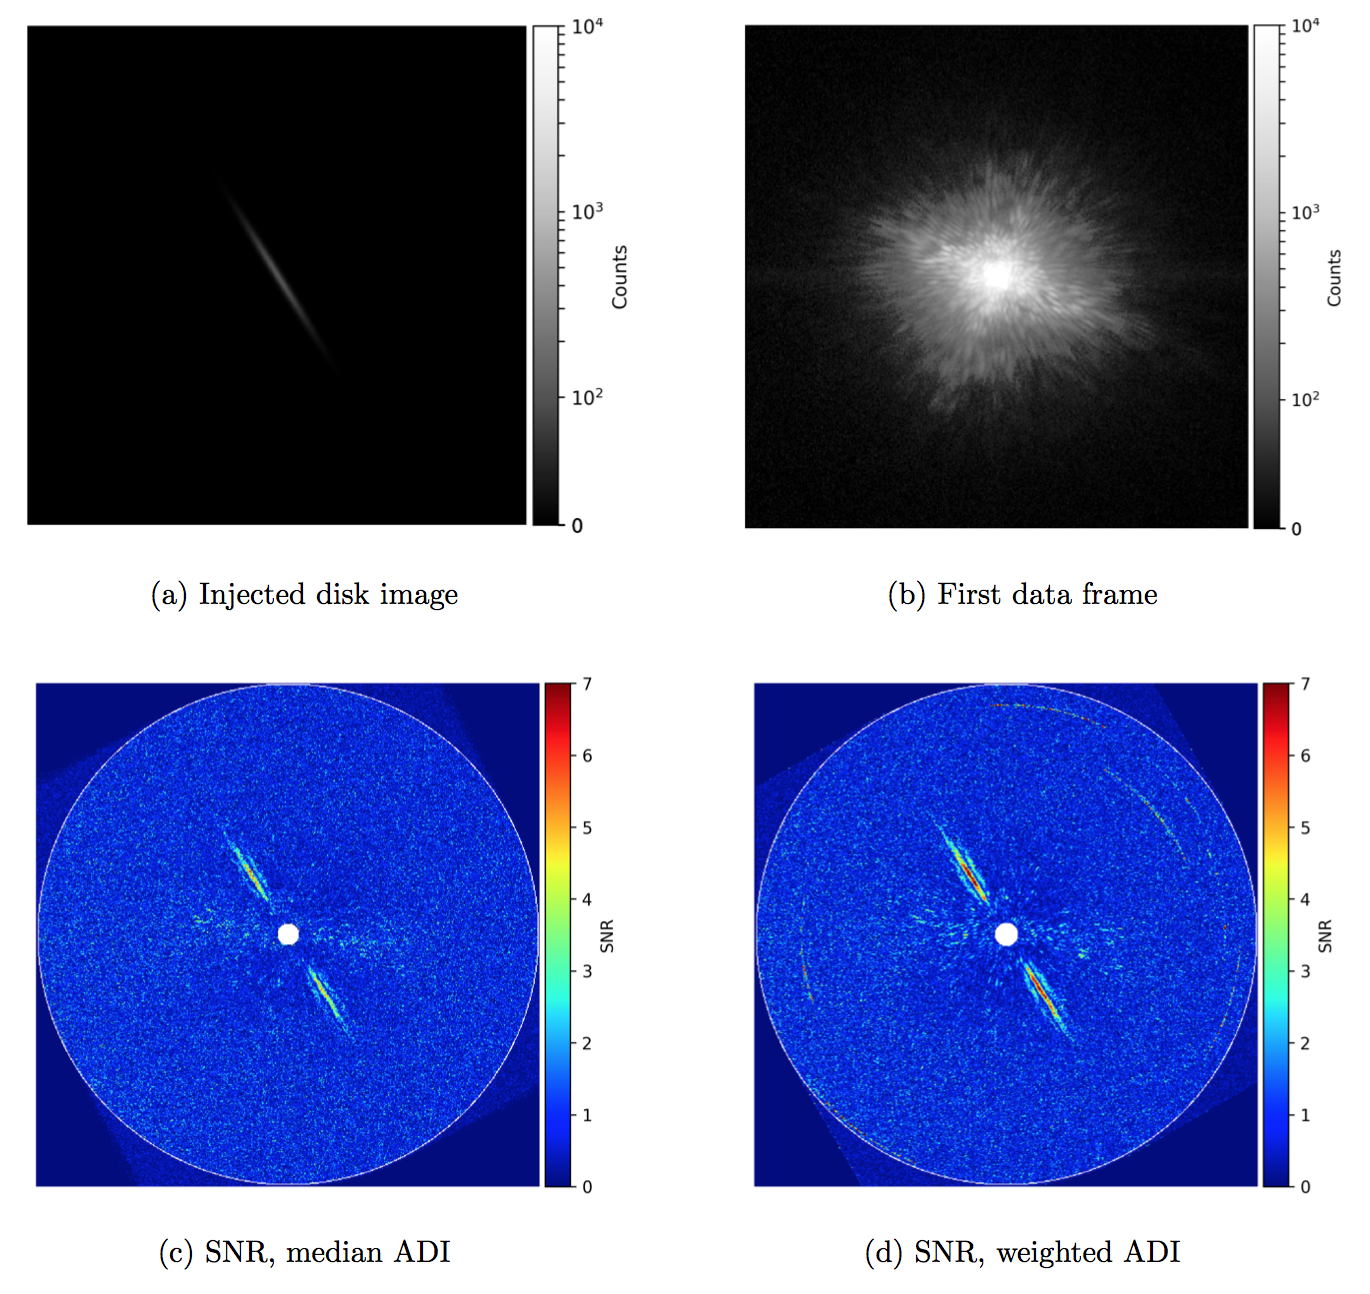
Fig 2. Disk imaging comparison. (a) Injected disk, with a max intensity of 100 counts/frame. (b) the first of 100 images in the unreduced datacube, shown for intensity comparison on the same scale. (c) SNR after reduction and derotation conventional ADI. (d) SNR after the same reduction but variance-weighted ADI derotation. Note that in the variance-weighted frames, streaks are visible from unremoved bad pixels.